December 08, 2025
Back to news
Carbon Watch
The data show that EUAs represent nearly 88% of the total notional value traded across all environmental commodity markets, and that much of this liquidity comes from futures contracts traded on the Intercontinental Exchange (“ICE”). In fact, more than 70% of the total value traded in the top four largest markets all comes from the futures contracts on ICE (and to a much smaller extent the Nodal Exchange as well). However, investors who participate in only EUAs, CCAs, UKAs, and RGGI, or only through derivatives, may be missing out.
While potentially cumbersome and more difficult to access, direct participation in auctions, and transacting physical credits bilaterally, can be very important sources of liquidity and in some cases the only way to access a market. Investors with the flexibility to cover positions in derivatives markets through physical settlement or who can source credits in auctions will, in our view, be better positioned to reduce or add exposure quickly when such action is either desired or necessary.
While small in comparison to the largest four, markets at the bottom of this list represent billions of dollars in transactions each year. These typically uncorrelated markets each present their own case for potential investment, and derivatives may not be an option. For example, the main source of liquidity in the CA LCFS market is through transacting in the physical credits, and historically this has been the only source to access ACCUs, NZUs, and Alberta TIER (note: futures contracts for all three markets have recently launched, but liquidity remains negligible so far).
Looking forward, it is our expectation that the total market size from our analysis will grow due to price appreciation and the introduction/availability of new markets. In the United States, new cap-and-trade (New York) and low carbon fuel programs (New Mexico) are likely around the corner. Globally, new emissions trading systems (e.g. Colombia, Brazil, India) and existing programs may yet open to foreign investment. ECP will continue to be a leader in the space, bringing investment and ever important liquidity and price discovery to new and existing markets based on a fundamental, data driven approach guided by decades of expertise in environmental commodities.
September 11, 2024
2023 Market Size and Liquidity in Environmental Commodities
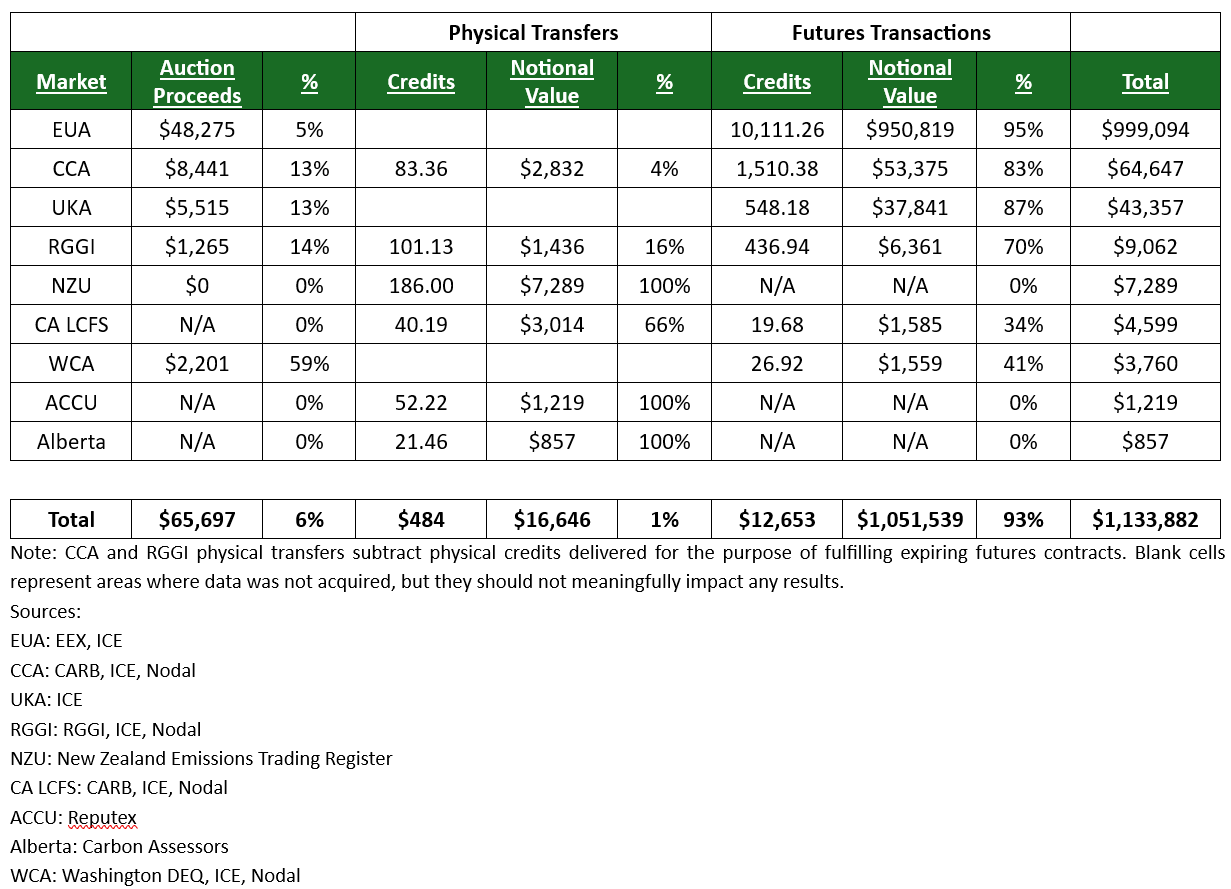
Based on ECP’s analysis, the estimated size of environmental commodity markets in 2023 is greater than $1.1 trillion. This number is the result of independent analysis by ECP into nine of the major compliance carbon markets accessible to investors. In our assessment, we sourced data from regulatory bodies who run auctions and oversee the transaction of physical allowances/credits, derivatives exchanges, and third-party analysts to arrive at a comprehensive, but conservative in our view, estimate of market size.
In the analysis we include the following markets:
European Union Emissions Trading System (EUAs)
California/Quebec Western Climate Initiative (CCAs)
United Kingdom Emissions Trading System (UKAs)
Regional Greenhouse Gas Initiative (RGGI)
New Zealand Emissions Trading System (NZUs)
California Low Carbon Fuel Standard (CA LCFS)
Washing State Cap-and-Invest Program (WCAs)
Australia Carbon Credit Unit Scheme (ACCUs)
Alberta’s Technology Innovation and Emissions Reduction Regulation Performance Standard (Alberta TIER)
“Market Size” in this context in the notional value (in USD) of all allowances either:
Auctioned to market participants, as reported by various parties that oversee carbon allowance auctions in a given market,
Allowances/credits physically transferred between market participants, as reported by various parties that regulate the transfer of carbon allowances between holding accounts, and/or
Derivative contracts (Futures) traded on various exchanges in which such contracts are available.
We recognize that aggregating diverse sources of data is never perfect. ECP has taken reasonable steps to scrub the data where possible. When a specific transaction price is unavailable, we have made assumptions on average monthly, quarterly, or annual price when necessary. When a trade in derivative contracts results in physical settlement (allowances exchange hands at the expiry of the futures contract) we do not count this transaction as it is likely also reported in data on physical transfers by the regulator as well. Not all markets provide data on physical transfers. We also do not include options trading on any derivatives exchange, although that is another source of liquidity/exposure available to many market participants. Our analysis excludes Renewable Energy Credits (where data is disaggregated), the Voluntary Carbon Market (where market sizing is historically based mostly on assumptions and estimates), other compliance markets not accessible to foreign investors (e.g. South Korea, China), and other markets often categorized as “Environmental Commodities” in which ECP may transact.
Despite these shortfalls, we believe the analysis shows environmental commodity markets are much larger than many may realize, even when pared down to just the sample size presented here.
Environmental Commodities 2023 Market Sizing (Figures & $ in Millions)
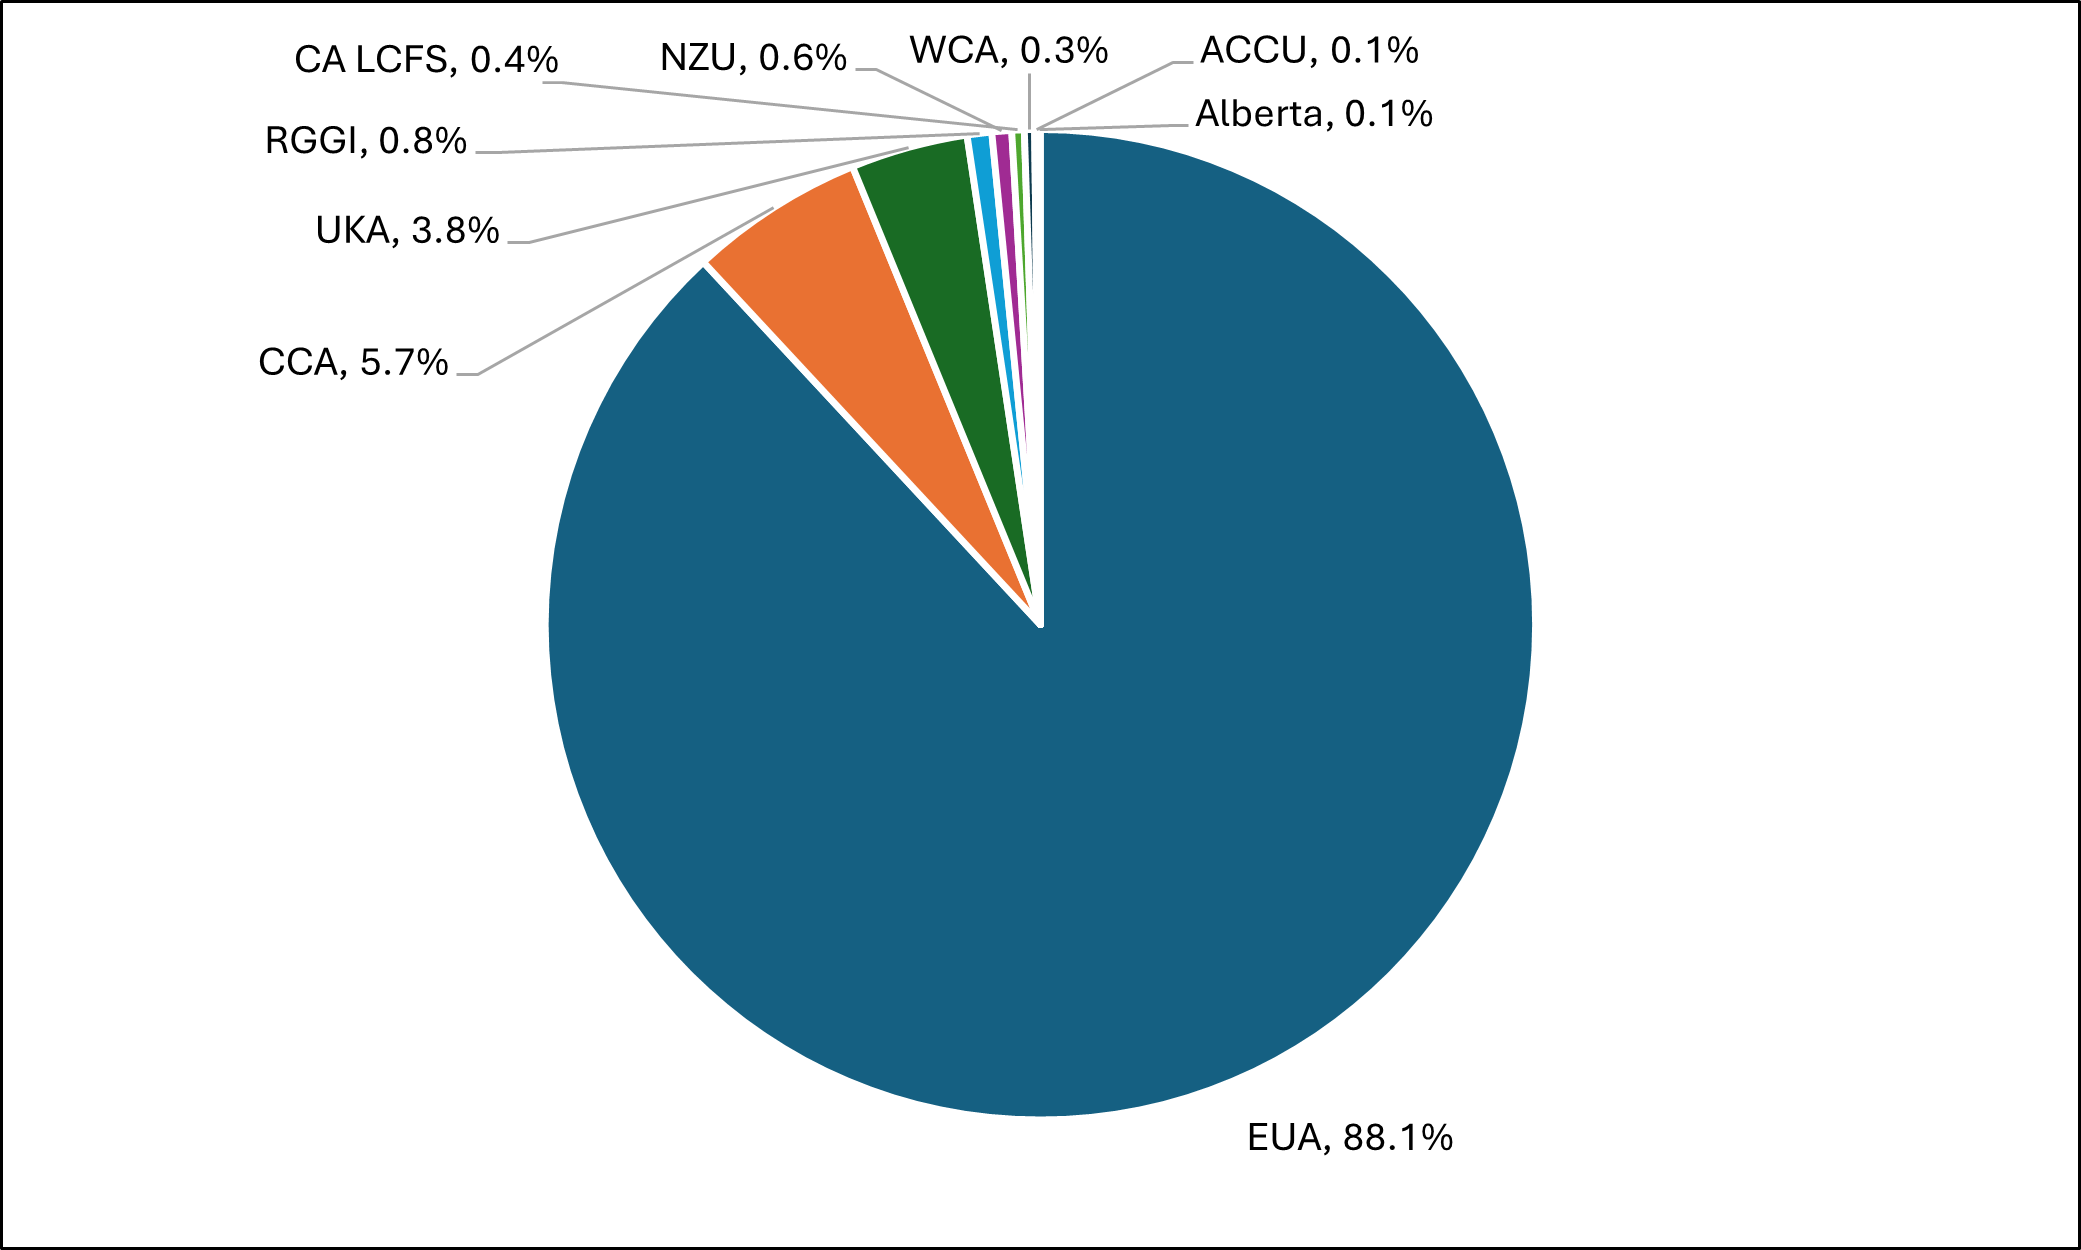
The data show that EUAs represent nearly 88% of the total notional value traded across all environmental commodity markets, and that much of this liquidity comes from futures contracts traded on the Intercontinental Exchange (“ICE”). In fact, more than 70% of the total value traded in the top four largest markets all comes from the futures contracts on ICE (and to a much smaller extent the Nodal Exchange as well). However, investors who participate in only EUAs, CCAs, UKAs, and RGGI, or only through derivatives, may be missing out.
While potentially cumbersome and more difficult to access, direct participation in auctions, and transacting physical credits bilaterally, can be very important sources of liquidity and in some cases the only way to access a market. Investors with the flexibility to cover positions in derivatives markets through physical settlement or who can source credits in auctions will, in our view, be better positioned to reduce or add exposure quickly when such action is either desired or necessary.
While small in comparison to the largest four, markets at the bottom of this list represent billions of dollars in transactions each year. These typically uncorrelated markets each present their own case for potential investment, and derivatives may not be an option. For example, the main source of liquidity in the CA LCFS market is through transacting in the physical credits, and historically this has been the only source to access ACCUs, NZUs, and Alberta TIER (note: futures contracts for all three markets have recently launched, but liquidity remains negligible so far).
Environmental Commodities - 2023 Size by Market
Looking forward, it is our expectation that the total market size from our analysis will grow due to price appreciation and the introduction/availability of new markets. In the United States, new cap-and-trade (New York) and low carbon fuel programs (New Mexico) are likely around the corner. Globally, new emissions trading systems (e.g. Colombia, Brazil, India) and existing programs may yet open to foreign investment. ECP will continue to be a leader in the space, bringing investment and ever important liquidity and price discovery to new and existing markets based on a fundamental, data driven approach guided by decades of expertise in environmental commodities.