December 08, 2025
Back to news
Carbon Watch
The increased adoption of EVs has a direct impact on supply and demand within Low Carbon Fuel Standard (“LCFS”) and Cap-and-Trade programs. As more EVs hit the road, demand for carbon credits generated from gasoline and diesel use decreases. The reduction in demand for fossil fuels also supports the objectives of LCFS programs by accelerating the transition to an overall lower-carbon transportation fuels pool.
April 30, 2024
Electric Vehicle Adoption Rates Impact Carbon Markets
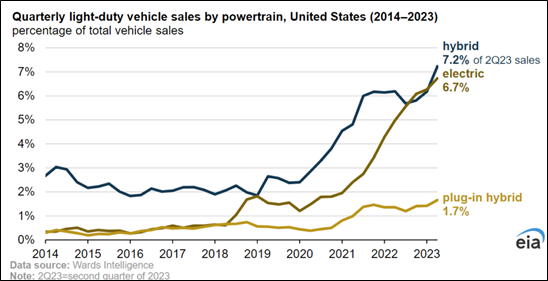
The Electric Vehicle (“EV”) market in the United States has shown significant growth, with total EV sales surpassing one million vehicles for the first time in 2023. This surge in sales represented an 8.1% market share of new light-duty vehicle sales in the fourth quarter of 2023 (battery electric vehicles only), up from 6.5% for the comparable prior-year period (source: CarEdge.Com, Electric Vehicle Sales and Market Share).
This trend indicates a growing acceptance of EVs among the American public, but it remains to be seen whether the rate of adoption will continue to increase or will slow down as the EV market penetrates the initial pool of likely buyers and early adopters.
The increased adoption of EVs has a direct impact on supply and demand within Low Carbon Fuel Standard (“LCFS”) and Cap-and-Trade programs. As more EVs hit the road, demand for carbon credits generated from gasoline and diesel use decreases. The reduction in demand for fossil fuels also supports the objectives of LCFS programs by accelerating the transition to an overall lower-carbon transportation fuels pool.
There are various federal/state government mandates and incentives in place aimed at promoting EV adoption. Among these are tax credits, LCFS credits, rebates, and Zero-Emission Vehicle (“ZEV”) programs which mandate that auto manufacturers sell a specific quota of EVs.
On March 20, 2024, the Biden administration expanded these mandates by introducing a new rule targeting tailpipe emissions, which may further influence EV adoption rates in the US. By tightening emissions standards, the rule is intended to promote the adoption of cleaner vehicles, including EVs, as manufacturers adjust their car portfolios to comply with the new standards.
Accelerated EV adoption would reduce reliance on carbon-intensive fuels, resulting in fewer deficits (less demand) generated by fuel distributors and greater credits (more supply) issued to EV owners (provided via their electric utilities) and charging infrastructure providers. Increased power demand from charging infrastructure will place greater load on the power grid, which could then drive increased demand for allowances under Cap-and-Trade programs (depending on the sources of power used to meet that demand).
The reality is that the eventual impact is complex and depends on a variety of factors, including technological advancements, the pace of energy transition to renewables, regulatory adjustments to the programs, and the actual rate of adoption and usage of EVs.
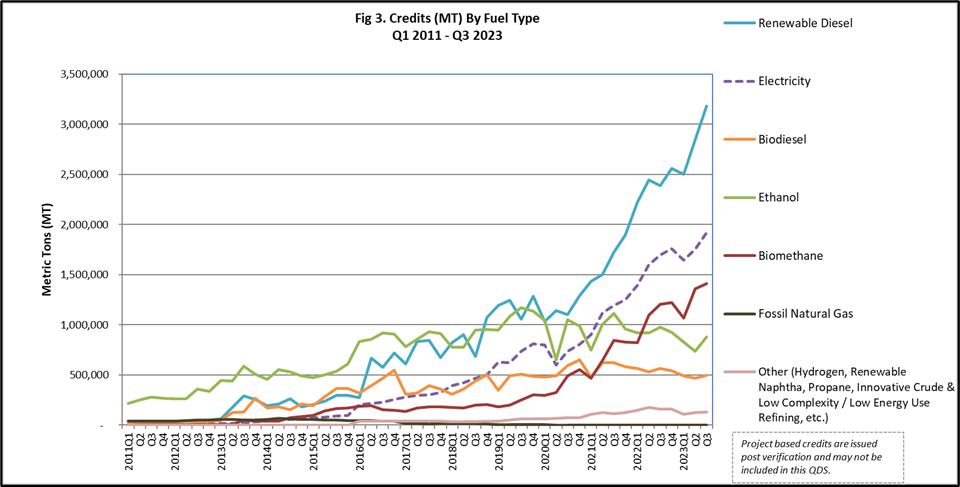
On a more granular level, Q3 2023 data released by the California Air Resources Board (“CARB”) show LCFS credits issued for on-road EV charging in California were 16.3% of total LCFS credits produced (source: CARB LCFS Data Dashboard). While total EV-related LCFS credit issuance grew by 17.0% when compared to Q3 2022, the contribution to the total LCFS credit pool grew by only 2.2%, a rate that declined significantly in 2023. In prior years there were material annual increases, with the Q3 2020 share of 10.4% growing to 12.5% in Q3 2021 (21.3% growth) and then again to 15.9% in Q3 2022 (26.9% growth).
It is too early to determine if the rate of growth will continue to decline. However, it is clear that as Renewable Diesel (the largest LCFS credit issuance category) reaches saturation levels in California, the second largest LCFS credit issuance category (EVs) will play an important role in determining future prices for both the Cap-and-Trade and LCFS programs in that state.